Most BI dashboards fail for one simple reason: they start with visuals, not decisions.
In many organizations, dashboards are treated as design exercises. The focus quickly shifts to charts, colors, and layouts, while the most important questions remain unanswered:
When you start your journey as a data analyst, it’s tempting to think that acing SQL queries, building complex dashboards, or mastering every new BI tool is the key to success. After all, technical skills are visible, tangible, and measurable. But here’s the hard truth: technical skills alone won’t make you indispensable.
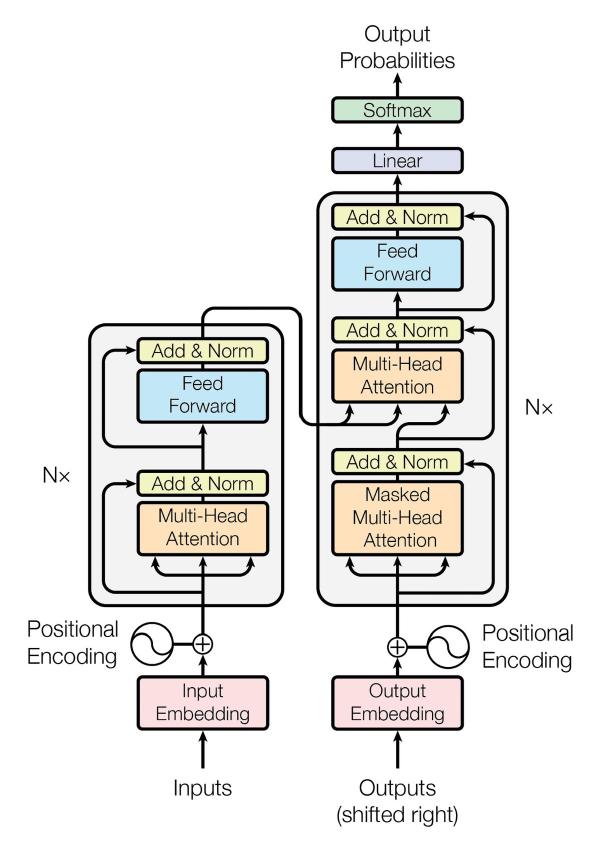
Large Language Models (LLMs) are everywhere now — chatbots, copilots, search, coding, writing, and reasoning.
This is my personal LLM cheatsheet: concise notes I use to refresh core concepts, training ideas, and practical techniques without diving back into papers or long courses.
When we talk about data fraud detection, most people think of complex models, AI pipelines, or forensic accounting teams armed with custom algorithms.
But sometimes, one of the most powerful tools is also one of the simplest.
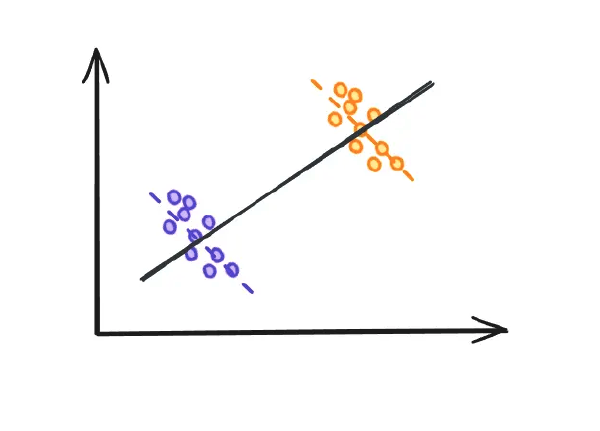
Simpson’s paradox is one of the most puzzling phenomena in statistics. It occurs when a trend observed in several distinct groups completely reverses once those groups are combined. In other words, what appears true within each subgroup can become false when the data is analyzed as a whole.